Performance benchmarks
It's always good to have a way to double-check your assumptions when it comes to WordPress performance.

Just because WordPress.com runs Memcached doesn't mean it will be the best fit for your site. Just because Kinsta or WP Engine use Google Cloud doesn't mean you have to burn your money away into that void. And just because a VPS plan is labelled as "high performance" or "compute optimized" doesn't mean it actually comes with great CPU allowance.
Benchmarks help you confirm or challenge various assumptions in your own environment, with your set of WordPress plugins, your database, and your workloads. Benchmarks help you make better decisions based on numbers.
Proper benchmarking and load testing are deep topics on their own. In this lesson we'll focus on a small fraction of that world. You will learn how to use lightweight tools and simple methods to measure the backend and cache performance of your WordPress site. Toward the end of the lesson you will find links for further reading to explore on your own.
Oha
Oha is a modern HTTP load testing tool written in Rust, available for Linux, macOS, and Windows. It comes with a wide range of options and features, including dynamically generated URLs and a nice-looking TUI.
All benchmarks presented in this lesson were run using Oha. In most cases we executed the tests from a local machine with realistic latency between the client and the origin server. This allowed us to test the effect of Cloudflare's CDN too. We also ran some tests from a remote VM when we reached our local network bandwidth limitations.
For readers following along, you can install Oha using the installation instructions for your OS and distribution, and verify connectivity using:
oha -c 1 https://uncached.org
Oha's key options used in these benchmarks include:
-zto run load tests for a fixed duration-cto control concurrency (default is 50)-wto wait for in-flight requests to complete when the timer ends
The main metric we focused on was the total number of successful requests served per test. Other metrics such as average latency, requests per second, size per request, and server load were used to help interpret whether a test was CPU- or network-bound.
Before comparing different environments, we made sure all tests were identical in software and data. Every WordPress instance used the same version, theme, and plugins, and ran on the same OS and software stack. The goal was to isolate hardware and infrastructure performance.
Cloudflare made it easy to switch origins between providers without DNS propagation delays or having to search and replace domains. All origin servers were located in the central or eastern United States, while the load tests were run remotely from London.
Dedicated servers vs cloud VMs
We picked three dedicated server configurations from Cherry Servers in the $200-300 range and tested them against three similarly priced cloud VM configurations. Our dedicated servers were:
- AMD Ryzen 9900X with 12 cores, 24 threads, 96 GB RAM, and 2x1 TB storage
- AMD Ryzen 9950X with 16 cores, 32 threads, 192 GB RAM, and 2x1 TB storage
- AMD EPYC 7543 with 32 cores, 64 threads, 64 GB RAM, and 2x500 GB storage
Storage was configured in a software RAID 1 setup, leaving about half of the total storage usable but redundant. The cloud VMs were:
- DigitalOcean: Premium-Intel 16 GB CPU-Optimized
- Amazon Web Services: c5.2xlarge CPU optimized
- Google Cloud Platform: c2.standard-8 ultra high performance
Below is the list of the tested specs and monthly costs:
| CPU | Memory | Storage | Transfer | Price | |
|---|---|---|---|---|---|
| Ryzen 9900X | 12C/24T | 96 GB | 1 TB | 100 TB | $220 |
| Ryzen 9950X | 16C/32T | 192 GB | 1 TB | 100 TB | $292 |
| EPYC 7543 | 32C/64T | 64 GB | 500 GB | 100 TB | $210 |
| AWS | 8 vCPU | 16 GB | 100 GB | - | $256 |
| GCP | 8 vCPU | 32 GB | 100 GB | - | $321 |
| DigitalOcean | 8 vCPU | 16 GB | 100 GB | 6 TB | $218 |
| DigitalOcean | 48 vCPU | 96 GB | 600 GB | 11 TB | $1,310 |
AWS and GCP charge separately for storage and bandwidth, so we factored in 100 GB of SSD storage for parity but excluded transfer costs. To make things a bit more interesting, we included a 48 vCPU / 96 GB DigitalOcean droplet worth a whopping $1,300 per month.
The load test
To ensure we were testing raw backend performance rather than a caching layer in between, we disabled edge caching for our domain at Cloudflare, as well as any page and object caching plugins in WordPress.
The test sites used:
- WordPress 6.8.3
- WooCommerce 10.3.3
- Storefront 4.6.1
- PHP 8.3.6
- MariaDB 10.11.13
The content included 500 posts, 100 pages, 20 media items, 100 orders, 100
products, and 10 users. The WooCommerce/Storefront /shop/ page generated 79
database queries and used about 10.8 MB of memory per request.
Given the difference in core and thread counts across configurations, we ran
several tests with PHP's max_children setting set at 8, 16, 32, and 64 workers
while adjusting Oha's concurrency to roughly four threads per worker. Each test
ran for ten minutes, preceded by a 30-second warm-up to prime PHP workers,
Opcache, and InnoDB buffers.
Results
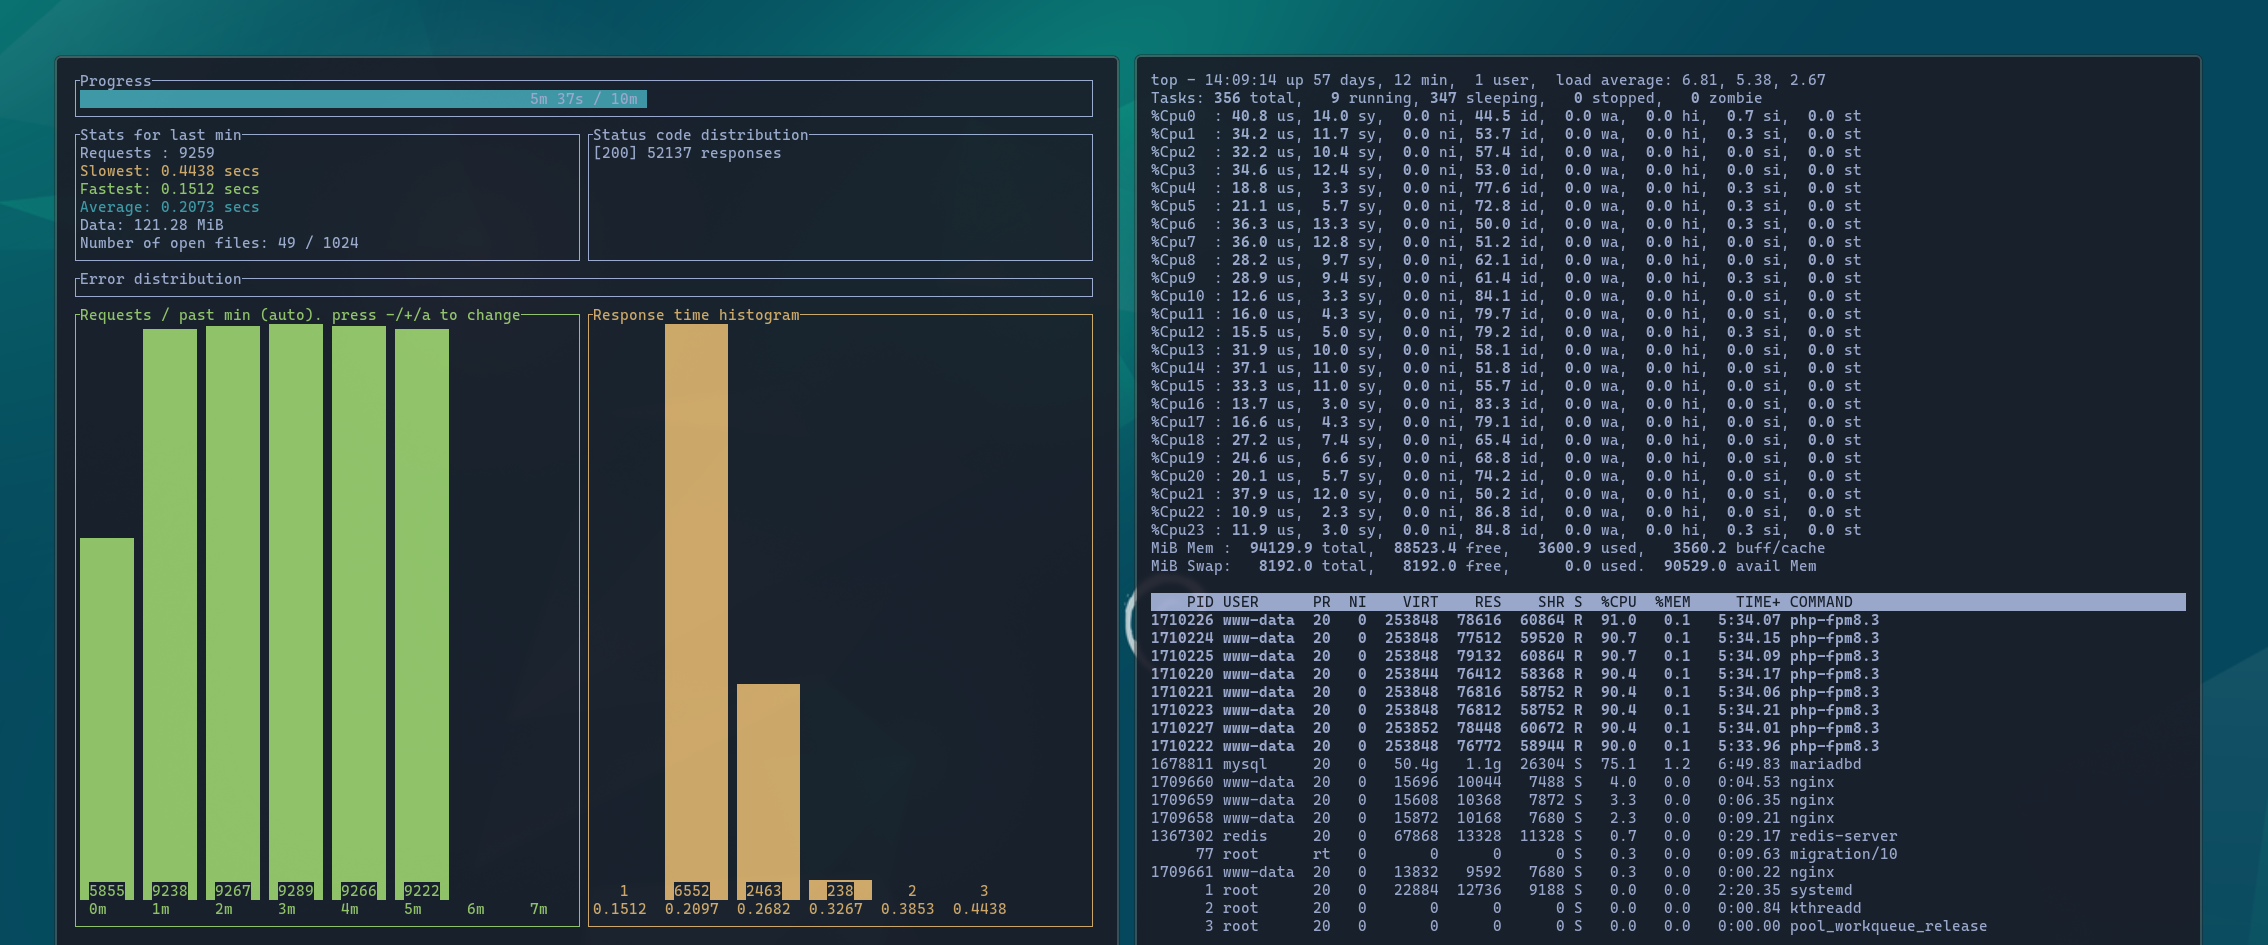
All tests completed without errors. We monitored each host using top to
understand when the load tests became CPU-bound, as well as bmon to watch for
network-bound tests.
The raw results are available in this spreadsheet. Below is a summary of the best-performing runs on each platform, sorted by throughput per dollar.
| Provider | Cost | Requests | Per second | Per dollar |
|---|---|---|---|---|
| EPYC 7543 | 210 | 185,514 | 308 | 883 |
| Ryzen 9950X | 292 | 250,338 | 417 | 857 |
| Ryzen 9900X | 220 | 175,343 | 292 | 797 |
| DigitalOcean 16G | 218 | 38,316 | 64 | 176 |
| DigitalOcean 96G | 1,310 | 185,565 | 308 | 141 |
| AWS c5.2xlarge | 256 | 27,902 | 46 | 109 |
| GCP c2.standard-8 | 321 | 29,277 | 48 | 91 |
The chart below provides a visual comparison of these results.
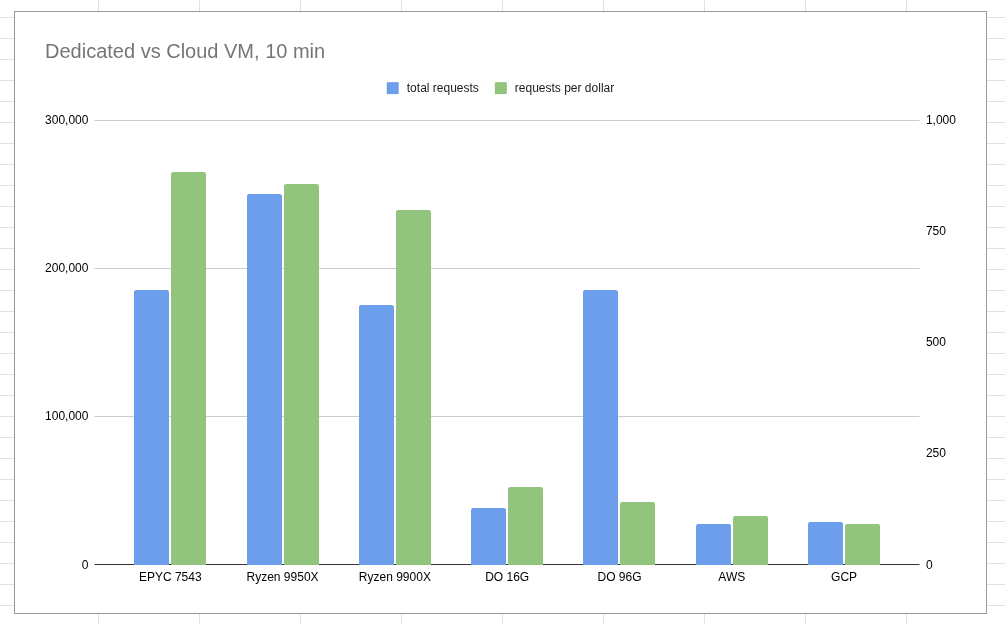
The three dedicated servers performed extremely well compared to similarly priced cloud VMs, with a 9x gap between the Ryzen 9950X and the AWS c5.2xlarge instance. Two of them even outperformed the $1300 DigitalOcean VM in absolute throughput, which itself ranked quite low on a per-dollar basis.
In the lower concurrency tests (8 PHP workers), the two Ryzen servers dominated their price group and even outperformed the more expensive VM. This is not surprising since the 9900X and 9950X are desktop-class CPUs. These often focus more on single-core performance at the expense of some cores, while general-purpose cloud providers focus more on core density.
Still, raw speed isn't the only factor when choosing infrastructure. Cloud instances usually offer more flexibility in scaling, disk expansion, and fault tolerance. These may sometimes be worth the performance trade-offs.
Object caching plugins
Next, we used the Ryzen 9900X to benchmark three different persistent object caching plugins for WordPress, with a 1 GB memory allocation for each. Below is a summary of the results:
| Object Caching | Requests | Per second | Avg. resp |
|---|---|---|---|
| SQLite | 103,583 | 173 | 0.185 |
| Redis | 99,350 | 166 | 0.193 |
| Memcached | 97,732 | 163 | 0.196 |
| None | 92,278 | 154 | 0.208 |
With our sample WooCommerce site containing 100 products, persistent object caching made quite a difference: a 5.9% gain with Memcached, 7.8% with Redis, and 12.3% with SQLite.
You might be surprised to see SQLite outperform both memory-based key-value stores. Given the Linux kernel page cache and enough memory, the entire SQLite database file is almost always fully cached in memory. This allows PHP to fetch data directly from memory in a much more efficient way, because there is no TCP or protocol overhead from Redis or Memcached. Writes, however, are probably less efficient, as they must actually be written to disk.
Even though we're running WooCommerce with some sample data here, this is not a very complex website. Different complexity and access patterns will often shift these results one way or another. I've seen websites perform significantly better without any persistent object caching, so it's a good idea to always measure your specific environment with your plugins and your data.
Full raw results are in the spreadsheet.
Page caching
The final benchmark focused on page caching. We used a similar setup but this time enabled the Surge and Batcache (with Memcached) page caching plugins. We also compared that with no page caching and serving directly from the edge via Cloudflare.
| Page Caching | Requests | Per second | Avg. resp |
|---|---|---|---|
| Cloudflare | 609,506 | 1,013 | 0.032 |
| Surge | 175,210 | 292 | 0.109 |
| Batcache | 172,672 | 288 | 0.111 |
| None | 92,358 | 154 | 0.208 |
These tests were done with 8 PHP workers at 32 concurrent requests. Much like in previous load tests, the variant with no caching plugins generated a 7.1 average load. This means that given 8 workers, it maxed out 8 CPU cores, making the test CPU-bound.
The cached variants, on the other hand, used close to 0 CPU for the entire duration of the load test, meaning they were nowhere near CPU-bound. Given that our 32-concurrency test with Cloudflare had almost maxed our local network bandwidth, we re-ran the tests from a VM with higher bandwidth and got the following results with 2048 concurrent requests:
| Page Caching | Conc. | Requests | Per second | Avg. resp |
|---|---|---|---|---|
| Cloudflare | 2048 | 10,048,501 | 16,745 | 0.114 |
| Surge | 2048 | 8,380,575 | 13,959 | 0.146 |
| Batcache | 2048 | 6,796,488 | 11,323 | 0.180 |
| Cloudflare | 32 | 609,506 | 1,013 | 0.032 |
| Surge | 32 | 175,210 | 292 | 0.109 |
| Batcache | 32 | 172,672 | 288 | 0.111 |
| None | 32 | 92,358 | 154 | 0.208 |
We couldn't run the 2048-concurrency test without any caching plugin, as that was already CPU-bound at just 32. With the higher concurrency we did get CPU-bound with both Surge and Batcache with the 8 PHP workers. At that point we were pushing about 1.6 Gbps of network traffic from our server.
The Cloudflare load test, as expected, generated 0% load on our origin server, and with that concurrency level we were consuming over 2.1 Gbps from just one Cloudflare PoP. We didn't want to push the boundaries of our free-tier account, so this is where we stopped.
Overall both Surge and Batcache can easily handle 10k RPS before getting CPU-bound, compared to only 154 RPS without a caching plugin. Surge seems to have a slight advantage in this setup, likely due to the lack of the Memcached dependency. That's over a 7000% gain for both.
Caching at the edge with Cloudflare, however, is in an entirely different league and definitely a great addition if you can integrate it with your page caching WordPress plugin.
Summary
Dedicated servers are often overlooked in the WordPress hosting world. Most upgrade paths move from cheap shared hosting to more expensive VPS/cloud hosting, then to even more expensive VPS and cloud instances.
The benchmarks above show a 6-9x improvement in dedicated server performance compared to leading cloud vendors in a similar price range. These results don't even take into account the huge difference in memory, transfer, and storage included in each price tag, as well as the inevitable noisy neighbors when opting for a virtual machine.
However, if you do decide, for whatever reason, to go with a cloud provider, it seems that DigitalOcean's "CPU optimized" plans currently offer noticeably better performance and a slightly lower price than Amazon or Google.
Both page caching and object caching have shown significant gains, with disk-based solutions having a slight edge over network-based ones.
Further reading
In-depth load testing and benchmarking are beyond the scope of this lesson, but if you're interested in learning more, here are a few good reads to get you started:
- Mastering the art of load testing for web applications
- A list of free and open source load testing tools
- Writing tests for Locust (we use this a lot internally)
- WordPress hosting benchmarks methodology