Understanding, measuring and logging response time with Nginx
There are plenty of performance metrics available when it comes to WordPress and other web applications. Some are quite arbitrary numbers or grades, like Google PageSpeed and WebPageTest.org scores. Others are very real, like the total size of a page, or how much time it takes from a sent request to the first byte of the response.
In this module we focus primarily on response time. This metric is very measurable, has little variance from outside factors such as latency, distance and network bandwidth. It is also heavily influenced by our server configuration, WordPress plugins and themes, and other things well within our control.
Response time
When an HTTP request reaches Nginx, it can take several paths. It might be a static file served from disk (or memory), a FastCGI request served from cache, or it could be passed to our PHP-FPM server for further processing, or even proxied to a remote HTTP service.
The time it takes from Nginx receiving the first byte of the request to Nginx
sending the last byte of the response is captured in the $request_time
variable. This includes any time spent waiting for upstream services.
When it comes to WordPress, however, we're usually more interested in the time spent waiting for PHP specifically. That's where most of the performance bottlenecks are, and that's where most optimization work should be targeted.
The time spent waiting for an upstream (PHP-FPM in our case) is captured in the
$upstream_response_time variable in Nginx.
Logging
We can log both the request time and upstream response time in Nginx using the
access_log and log_format directives. Let's update our JSON log file format
to include both in /config/nginx/nginx.conf:
http {
    log_format json escape=json
        '{'
            '"time_local":"$time_local",'
            '"remote_addr":"$remote_addr",'
            '"cloudflare_ray_id":"$http_cf_ray",'
            '"cloudflare_country":"$http_cf_ipcountry",'
            '"request_time":"$request_time",'
            '"upstream_response_time":"$upstream_response_time",'
            '"request":"$request",'
            '"status":"$status"'
        '}';

    # ...
}
Make sure your site configuration is using this log format:
server {
    access_log /sites/uncached.org/logs/access.log;
    access_log /sites/uncached.org/logs/access.json.log json;
    error_log /sites/uncached.org/logs/error.log warn;

    # ...
}
This will write an access.json.log alongside the original access.log. I
usually keep the original access log for compatibility reasons. There are plenty
of online tools built decades ago that support this specific format.
For all my complex querying needs though, I almost always use the JSON log.
Querying
While you can still use sed, grep and all the other standard Linux tools for
searching and manipulating text, when it comes to JSON,
jq is king. It's incredibly powerful, very modern, and
has quite a large community that's ready to help when your AI fails to deliver.
You can get jq using apt in Ubuntu and other Debian-based distributions.
While we're at it, let's also get datamash, a very useful command-line tool
for compiling various stats, as you will see shortly.
sudo apt install jq datamash
The following query shows all requests that took longer than 0.3 seconds in the PHP upstream:
jq -r 'select(.upstream_response_time | tonumber? > 0.3)' \
  /sites/uncached.org/logs/access.json.log
Here's one that shows just the upstream response times for the last 1000 requests:
jq -r 'select(.upstream_response_time | tonumber? > 0) | .upstream_response_time' \
  /sites/uncached.org/logs/access.json.log | tail -n1000
Not very useful on its own, but we can combine this with datamash:
jq -r 'select(.upstream_response_time | tonumber? > 0) | .upstream_response_time' \
  /sites/uncached.org/logs/access.json.log | tail -n1000 \
  | datamash --header-out min 1 max 1 mean 1 median 1 perc:95 1 count 1 \
  | column -t
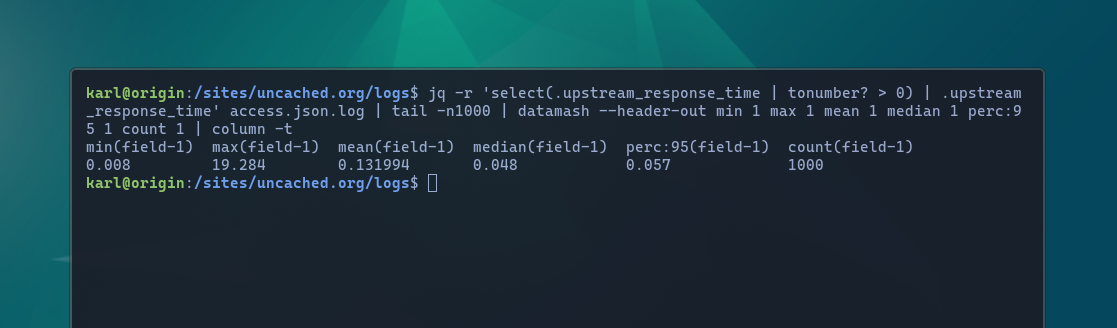
This gives us the minimum, maximum, averages, and the 95th percentile of the upstream response times in the last 1000 PHP requests. This can be used for reporting, monitoring and alerts. It's also fun to watch during a load test.
This article is for premium members only. One-time payment of $196 unlocks lifetime access to all existing and future content on wpshell.com, and many other perks.