Enabling MariaDB's slow query log
In this lesson you will enable MariaDB's slow query log, configure a threshold and log file location, learn about tagging SQL queries in WordPress with a mu-plugin, and using tools like mariadb-dumpslow to analyze results.
Slow query log
The slow query log is a very useful diagnostic tool for MariaDB and MySQL. It is a record of SQL queries that took a long time to perform. Information in this log can help you identify performance bottlenecks in your WordPress application, as well as opportunities for query and schema optimizations.
Unlike PHP and Nginx logs, the MariaDB slow query log is a global one and there is no easy way to separate things out into different files. We can, however, tag queries with site names and/or Cloudflare request IDs, to be able to filter them later.
Enabling the slow query log
By default the log is disabled in MySQL and MariaDB. We can enable it in the
[mysqld] section of our global configuration file in /config/mysql/global.cnf:
[mysqld]
slow_query_log = 1
long_query_time = 5
slow_query_log_file = /var/log/mariadb-slow.log
The first slow_query_log flag enables the slow query log. The next
long_query_time option sets the threshold to 5 seconds, which I think is a
good default for most WordPress applications. The last slow_query_log_file
option sets the path of the slow log.
You can place this log file wherever you like, but make sure the mysql user
has access to write to this file. I like to keep mine in /var/log, so I
need to create this file and change ownership before MariaDB can write to it:
sudo touch /var/log/mariadb-slow.log
sudo chown mysql:mysql /var/log/mariadb-slow.log
sudo chmod 0640 /var/log/mariadb-slow.log
Note that the log entries in this file are going to appear as is, so if there
is a password or any other sensitive information in a query that's slower than
the threshold, then it is going to end up in the log in plain text. That's why
I recommend using 0640 permissions for this file, with access only to the
mysql user and group (and sudo/root of course).
All three MariaDB variables we used are dynamic, which means we can also set
them on a live database using SET GLOBAL to avoid a service restart if
necessary. Restarting the service will also work just fine, especially if
you're not serving production traffic yet:
sudo systemctl restart mariadb.service
Testing
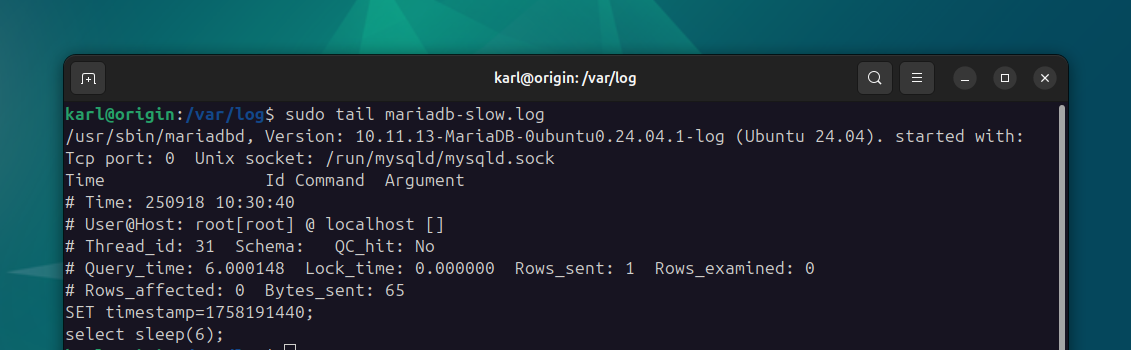
The easiest way to ensure the slow query log is working is by running a slow query:
sudo mariadb
> SELECT SLEEP(6);
This should result in the following entry in your mariadb-slow.log file:
# Time: 250918 10:30:40
# User@Host: root[root] @ localhost []
# Thread_id: 31  Schema:   QC_hit: No
# Query_time: 6.000148  Lock_time: 0.000000  Rows_sent: 1  Rows_examined: 0
# Rows_affected: 0  Bytes_sent: 65
SET timestamp=1758191440;
SELECT SLEEP(6);
If this was a query against a specific database, you'd see the name of the
database in the Schema: section. This allows us to distinguish slow queries
from multiple sites sharing the MariaDB database service.
Tagging
Another way to distinguish queries from different sites is by tagging them with a comment, which is a technique I use quite a lot. This allows me to not only tell which site ran the slow query, but precisely which request triggered it too.
This article is for premium members only. One-time payment of $196 unlocks lifetime access to all existing and future content on wpshell.com, and many other perks.